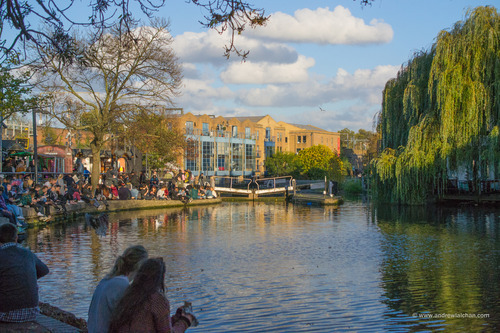
My first autumn in Bromley, has been a warm wet one. In England as a whole this will be the 3rd warmest in the 356 years since the records began. Over the whole year we are still on course to be the warmest year recorded in 356 years.
In Bromley September started very dry with only 7.5mm of rain and 7 rainy days with a warm month. It gradually started getting wetter during October with 93mm of rain and 15 rainy days. It was a continuation of the mild weather which we have seen this year. November continued the rain theme but not as wet was October having 84.9mm of rain with 19 rainy days and mild again. Below are the statistics for each of the autumn months.

Winter 2014
So what can we look forward to in the coming winter, it is currently looking like there will be a change to dry weather with more high pressure. It will feel colder than what we have experience all year. Depending on the amounts of cloud there will be a few frosts. Further afield the computer models are starting to show signs of more atlantic weather systems arriving at our shores but from the NW. This produces cooler wetter weather.
Bromley statistics for Autumn 2014
Summary for November 2014
Temperature (°C):
Mean (1 minute) 9.3
Mean (min+max) 10.0
Mean Minimum 6.2
Mean Maximum 13.9
Minimum -0.5 day 05
Maximum 19.7 day 08
Highest Minimum 11.4 day 01
Lowest Maximum 8.8 day 25
Air frosts 3
Rainfall (mm):
Total for month 84.9
Wettest day 14.1 day 23
High rain rate 86.4 day 10
Rain days 19
Dry days 11
Pressure (mb):
Maximum 1032.2 day 24
Minimum 987.5 day 03
Days with snow falling 0
Days with snow lying at 0900 0
Summary for October 2014
Temperature (°C):
Mean (1 minute) 13.8
Mean (min+max) 15.0
Mean Minimum 10.4
Mean Maximum 19.7
Minimum 2.2 day 04
Maximum 23.9 day 31
Highest Minimum 15.8 day 18
Lowest Maximum 13.7 day 14
Rainfall (mm):
Total for month 93.0
Wettest day 23.4 day 12
High rain rate 18.0 day 09
Rain days 15
Dry days 16
Pressure (mb):
Maximum 1020.4 day 02
Minimum 990.9 day 06
Summary for September 2014
Temperature (°C):
Mean (1 minute) 16.7
Mean (min+max) 17.9
Mean Minimum 11.9
Mean Maximum 24.0
Minimum 5.5 day 21
Maximum 24.2 day 28
Highest Minimum 16.5 day 19
Lowest Maximum 19.7 day 11
Rainfall (mm):
Total for month 7.5
Wettest day 2.7 day 01
High rain rate 7.2 day 01
Rain days 7
Dry days 23
Pressure (mb):
Maximum 1018.6 day 13
Minimum 1004.4 day 17
More information on the CET can be found on the Met Office website – https://www.metoffice.gov.uk/hadobs/hadcet/cet_info_mean.html
Photos taken in Camden – more on www.flickr.com/alalchan


